Women in academia

In short
- Today, 45% of PhD students are women, while only 28% of Dutch professors and 34% of associate professors (UHDs) are women (2022).
- This ratio is different for university teachers (UDs), where the percentage of women is 46% (2022).
- A faster appointment as professor after a PhD can have a positive effect on the proportion of female professors.
On 10 February 2017, it was exactly one hundred years ago that the first female professor in the Netherlands took up her post. At the time, Johanna Westerdijk was appointed professor of plant pathology. In 2022, 28% of professors in the Netherlands are women, while since the beginning of this century there have been more women than men in the lecture room. Women are under-represented in scientific positions and the higher the job level, the more unequal the ratio of women to men. If the policy remains unchanged, it will take many more decades before this will change. (Stichting Landelijk Netwerk Vrouwelijke Hoogleraren, 2016).
The policy aimed at more women in science focuses primarily on appointments. This is one of the aspects on which the policy can focus. In this fact sheet, we examine the appointments of professors, associate professors and university lecturers. To this end, the appointments are related to the availability of candidates; the PhD candidates.
The basics: obtaining a PhD from a university
A PhD is the gateway to an academic career. Information on the number of PhDs awarded at Dutch universities was first collected in 1920. There were 270 PhDs awarded that year, 25 of them to women – just under 10% of the total. It took until the mid-1980s before that figure rose consistently beyond 10% (between 1920 and 1985, it was 6.6%).
The development in the period thereafter is shown in the graph below. In addition to the total figures (blue line), we also show the figures excluding the promotions of the faculties of medicine/university medical centres (umc's) (red line).
| Dissertations; total share of women | Dissertations; share of women exluding medical field | |
| 1985 | 8,60% | 10,21% |
| 8,80% | 7,27% | |
| 1987 | 12,40% | 11,88% |
| 13,40% | 12,83% | |
| 1989 | 15,60% | 14,19% |
| 15,60% | 13,74% | |
| 1991 | 17,90% | 15,84% |
| 19,90% | 17,92% | |
| 1993 | 19,80% | 17,76% |
| 23,20% | 21,60% | |
| 1995 | 23,80% | 22,02% |
| 27,50% | 24,70% | |
| 1997 | 27,50% | 23,88% |
| 29,00% | 23,49% | |
| 1999 | 30,10% | 27,13% |
| 32,50% | 29,87% | |
| 2001 | 31,60% | 27,88% |
| 34,70% | 30,36% | |
| 2003 | 36,20% | 33,89% |
| 36,10% | 32,69% | |
| 2005 | 38,10% | 33,45% |
| 38,70% | 33,16% | |
| 2007 | 41,80% | 36,40% |
| 41,70% | 36,80% | |
| 2009 | 41,60% | 36,51% |
| 42,10% | 37,17% | |
| 2011 | 43,80% | 38,51% |
| 44,90% | 39,10% | |
| 2013 | 46,20% | 39,96% |
| 47,30% | 41,42% | |
| 2015 | 49,10% | 42,20% |
| 48,70% | 41,76% | |
| 2017 | 47,90% | 41,90% |
| 48,10% | 41,80% | |
| 2019 | 47,42% | 40,96% |
| 49,70% | 43,14% | |
| 2021 | 50,00% | 43,84% |
| 49,90% | 41,68% |
The development is clear: from 8.8% women in 1985 to nearly 50% in 2022. There are large differences between the various fields of science. The strongest increases are seen in Technical Sciences (from 2,5% to 28,4%), Natural Sciences (from 6% to 32.5%) and Agricultural Sciences (from 8% to 50.6%). If we look exclusively at the universities excluding the university clinics, we see that the growth in the number of women among PhD graduates does not exceed 44%. In the Medical Sciences, the number of PhDs awarded to women in 2006 was already equal to the number of men in 2006 and in 2022 the share of women is 62.6%.
Analysis of new appointments by year
Our analyses show that the average age of candidates who have completed their PhD is 29.5, that assistant professors are an average of 37 years of age upon appointment, that the average age at which associate professors are granted an appointment is 42, and that professors are an average age of 49 when they take up their post (based on data taken from the WOPI University Staff Information System provided by UNL for the 2003-2015 period; no comparable data are available for university hospitals).
The current policy on more women in science is mainly aimed at appointments and selection committees and does not focus on the male/female ratio of the potential candidates. Therefore, we present analyses in which the male/female ratio of all newly appointed UDs, UHDs and professors is compared to the male/female ratios in promotions for, respectively, seven, twelve and nineteen years prior to the appointment of UD, UHD and professor. If the careers are gender-neutral, the male/female ratio in the appointments of professors in, for example, 2015 will correspond to the male/female ratio in the promotions of nineteen years earlier, 1996. The question is whether these ratios correspond.
Universities name an average of 276 new professors every year. Of these, 52 are women (19%). If we compare appointments in the 2004-2015 period with our forecast (based on PhDs awarded 19 years earlier), we get the following.
| appointments professor % women | appointments professor % women expected | |
| 2004 | 16,00% | 10,20% |
| 2005 | 10,00% | 7,30% |
| 2006 | 14,50% | 11,90% |
| 2007 | 18,60% | 12,80% |
| 2008 | 15,30% | 14,20% |
| 2009 | 14,80% | 13,70% |
| 2010 | 20,20% | 15,80% |
| 2011 | 26,50% | 17,90% |
| 2012 | 20,60% | 17,80% |
| 2013 | 22,90% | 21,60% |
| 2014 | 24,40% | 22,00% |
| 2015 | 27,40% | 24,70% |
The graph above shows that the percentage of women in the new appointments is rising and is slightly above expectations when we look at the male/female ratio in the number of promotions 19 years earlier. On average, there are nine more female professorial appointments per year than one would expect based on the male/female ratios in promotions in the past. In the last year (2015), we see that 27% of full professor appointments are women.
In the case of UDs and UHDs, we see similar patterns. On average, 292 UHDs are appointed per year, 87 of whom are women (28%). Seven more female UHDs are appointed each year than we would have expected on the basis of the male/female ratio in promotions twelve years earlier. On average, 285 women are appointed to the UDs out of a total of 706 appointments per year (40%). That is 67 female UDs more per year than expected on the basis of the male/female ratio in the number of promotions seven years earlier. The appointments of male and female academic staff have been equal in number since (2015).
Note: all these figures are exclusive of the HOOP classification Health, where the development of the number of female PhD students is much stronger. The rise of women in science started earlier here and in 2006 the number of female PhDs was equal to the number of male PhDs.
There are also differences between the scientific disciplines. In the Social Sciences (including Law and Economics) and Natural Sciences, we see that the expected and actually observed gender distribution is almost the same. In Language and Culture we see a somewhat larger positive balance. Based on the male/female ratio for promotions 19 years earlier, the expectation is 24.1% women, whereas for the new professorships 26.7% are women. The largest difference can be seen in Engineering: 6.1% based on expectations versus 11.5% in the actual appointment of professors nineteen years later. Information on the development of the number of female professors per discipline can be found in the factsheet on Professors.
Academic careers by position and gender
In the graph below, the composition of the workforce of the universities (excluding health sciences/UMCs) is presented. The numbers of full professors (HGL), associate professors (UHD) and assistant professors (UD) are presented as separate groups. In addition, there is a category for teachers (OWPOW), researchers (OWPOZ) and other academic staff (OVWP) and we have the PhD students (PROM).
Note: women are presented on the right and men on the left. All numbers are in full time equivalents (fte).
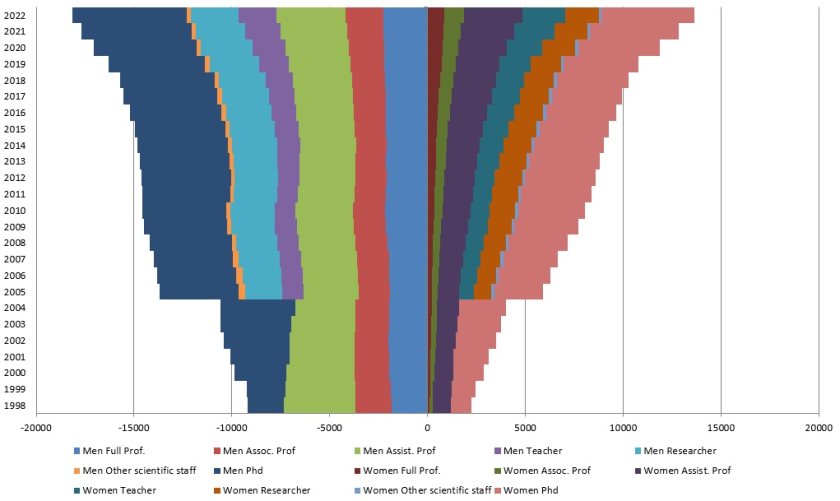
Note: (See 'additional information WOPI'.)
In the case of men, the number of professors is increasing more rapidly than the number of UHDs and UDs compared to 2005. We also see a considerable development among lecturers, researchers and PhD candidates. For men, the career path is thus developing at a steady pace. For women, the development of their career path is different. The size of the group of female staff at the beginning of this time series was still very limited and consisted mainly of UDs, PhD students, lecturers, researchers and other WP. At the two highest function levels, the number of female staff was still very limited. In 1998, there were just 100 FTE female professors and 150 FTE female UHDs. In 2005 these numbers were 210 and 1087 FTEs. In all job categories, a strong development has been visible since then, which means that the gender gap is narrowing slightly every year. However, the total number of fte women is still almost 5,000 less as compared to men in 2022.
The question is how this will develop further. After all, in addition to the growth in the total number of women, we also see a growth in the number of men. The composition among men is relatively constant: for instance, at the highest level we see that one in seven male scientists at the universities is a professor. This has been the case throughout the entire period. For women, it was 1 in 34 in 1998 and 1 in 16 in 2022. Evidently, this is still a far cry from the ratio among men.
The road to more female representation in higher academic functions
To give space for female academics the following factors could be of influence:
- The size and growth of the total academic workforce is an important factor. When there is more growth there are more opportunities to attract more female academics.
- The development of the male/female ratio among PhD candidates determines the supply of candidates for higher positions. In 2015 we saw (including the health sector) an approximately 50-50 ratio of men to women. However, the figures of the last two years indicate a slight decrease in the proportion of women. We do not know whether this is temporary or the beginning of a trend. The further development may have consequences for appointments later on. In the case of professors, such an effect will be visible in the early thirties of this century.
- The period between promotion and appointment as a full professor can be shorter or longer. If this period becomes shorter, this will have a positive effect, because a larger number of female PhD candidates will be able to progress more quickly to a position as a full professor. It is important to monitor to what extent a rapid growth of the number of female professors will be at the expense of the proportion of women in the UHD population.
Data on PhDs were obtained from Statistics Netherlands (CBS), which in turn obtained them from the individual universities where the PhDs were awarded. They are complete for all the disciplines. Data on number of new appointments were sourced from microdata in the universities’ WOPI University Staff Information System, which UNL made available to the Rathenau Institute. These microdata date back to 2003. For this factsheet, we analysed the figures on an individual basis. We calculated the number of appointments made in a given year by comparing staff figures in two consecutive years. That was possible because the WOPI System contains unique personal IDs. However, that ID is used only within the relevant university.
If an academic transfers from one university to another, the WOPI System registers this in the same way as someone who originated in another segment of the Dutch or foreign job market and has accepted an academic post with the university: he or she is assigned a new ID. The figures do not permit us to analyse the entire period for post-doctoral fellows, as this is not an identifiable staff category. No such data are available for academics working in the field of health (university hospitals).
The few figures available on university hospitals concern the number of professors broken down by gender and institution for the years 2009, 2012 and 2015 (source: Stichting de Beauvoir/LNVH). Flow figures such as those based on the WOPI data are virtually non-existent for university hospitals. Data from Narcis (Gateway to Scholarly Information in the Netherlands) and DANS (Data Archiving and Networked Services) have been analysed. These data make it possible to analyse professors of medicine as a separate category. Unfortunately, these sources only have data covering four years. Since the medical sciences were the first to achieve gender parity in number of PhDs awarded and since this field employs approximately a third of all academics in the Netherlands, patterns in this field (unknown to us) may have an impact on the overall figures. We are unable to perform a reliable analysis of new appointments in medicine compared with PhDs awarded 19 years earlier because the data do not include appointment figures for professors. The comparison also proved difficult in agriculture because the WOPI System classifies veterinary science under the field of health, whereas Statistics Netherlands classifies it under agriculture. This means that WOPI places veterinary science in a different data category than Statistics Netherlands.
The data are obtained from the WOPI-file of UNL. The WOPI-data (Information on scientific education personnel) is annually requested by UNL from fourteen universities, conform a standardized format and agreed definitions. The reference date for the WOPI-data is 31st December for each year. All personnel is included who have a permanent or temporary employment contract or contractual agreement for a fixed number of working hours at a university. Student-Assistants excluded.
Over time, the personnel of almost all the academic hospitals have moved from the medical faculty or university as employer towards the academic hospital or the university medical centre (umc). The scientific field (HOOP-classification) Health sciences therefore shows an inconsistent pattern over time and is therefore not included in the data and graphs.
For an explanation of the used definitions and abbreviations we refer to the webpage Definitions for Science in Figures.