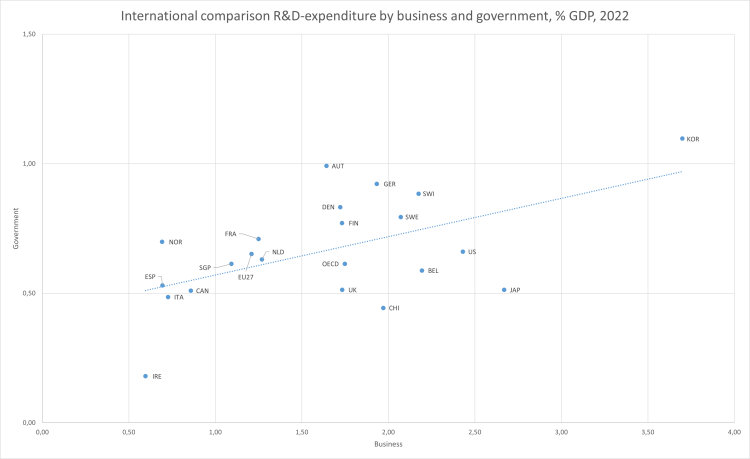
R&D expenditure, funded by the government and companies, as a % of GDP
To get a good overview of Dutch R&D expenditure, we can compare the expenditure with other countries. In this data publication, we compare R&D expenditure as a percentage of GDP. We look at total expenditure, at government expenditure and at company expenditure.
In short
- Total Dutch R&D expenditure as a percentage of GDP is above the EU27 average, but below the OECD average.
- The R&D expenditure of the Dutch government is just above the OECD average but below the EU-27 average.
- The R&D expenditure funded by companies is just above the EU-27 average but below the OECD average.
R&D expenditure as a percentage of GDP
| Other | Government | Business enterprises | |
| KOR | 0,05 | 1,1 | 3,7 |
| US | 0,4 | 0,66 | 2,43 |
| SWE | 0,55 | 0,79 | 2,07 |
| BEL | 0,62 | 0,59 | 2,19 |
| JAP | 0,22 | 0,51 | 2,67 |
| SWI | 0,24 | 0,88 | 2,17 |
| AUT | 0,54 | 0,99 | 1,64 |
| GER | 0,22 | 0,92 | 1,93 |
| FIN | 0,48 | 0,77 | 1,73 |
| DEN | 0,35 | 0,83 | 1,72 |
| UK | 0,55 | 0,51 | 1,73 |
| OECD | 0,31 | 0,61 | 1,75 |
| CHI | 0,08 | 0,44 | 1,97 |
| FRA | 0,26 | 0,71 | 1,25 |
| NLD | 0,28 | 0,63 | 1,27 |
| EU27 | 0,26 | 0,65 | 1,21 |
| SGP | 0,14 | 0,61 | 1,09 |
| CAN | 0,44 | 0,51 | 0,86 |
| NOR | 0,16 | 0,7 | 0,69 |
| IRE | 0,76 | 0,18 | 0,6 |
| ESP | 0,18 | 0,53 | 0,69 |
| ITA | 0,15 | 0,49 | 0,73 |
Explanatory note
R&D-expenditure as percentage of GDP is above the EU-27 (2021) average but below the OECD average. In 2022, total Dutch R&D expenditure was 2,18% of GDP. This is between the averages of the OECD (2.68) and the EU27 (2.12 in 2021).
R&D expenditures by the government
| government | |
| KOR | 1,097301742 |
| AUT | 0,991760304 |
| GER | 0,92247827 |
| SWI | 0,884484999 |
| DEN | 0,832683388 |
| SWE | 0,794306242 |
| FIN | 0,771258196 |
| FRA | 0,709363513 |
| NOR | 0,698576184 |
| US | 0,660644084 |
| EU27 | 0,651980603 |
| NLD | 0,630738766 |
| SGP | 0,613737043 |
| OECD | 0,613564275 |
| BEL | 0,588023237 |
| ESP | 0,530423426 |
| JAP | 0,513550333 |
| UK | 0,513342553 |
| CAN | 0,510217683 |
| ITA | 0,485708227 |
| CHI | 0,443339774 |
| IRE | 0,179907771 |
Explanatory note
Dutch government R&D expenditure is just below the EU-27 (2021) average and above the OECD average.
R&D expenditures by business enterprises
| business enterprises | |
| KOR | 3,699303496 |
| JAP | 2,669105237 |
| US | 2,430817091 |
| BEL | 2,194116791 |
| SWI | 2,174205318 |
| SWE | 2,071709861 |
| CHI | 1,971045945 |
| GER | 1,932702633 |
| OECD | 1,748445943 |
| UK | 1,733454902 |
| FIN | 1,731582468 |
| DEN | 1,721712467 |
| AUT | 1,642021819 |
| NLD | 1,268961784 |
| FRA | 1,249558735 |
| EU27 | 1,208754141 |
| SGP | 1,092889759 |
| CAN | 0,858102941 |
| ITA | 0,726537965 |
| ESP | 0,694177904 |
| NOR | 0,691945078 |
| IRE | 0,595888684 |
Explanatory note
Business expenditure on R&D is just above the EU-27 (2021) average and below the OECD average.

Notes: Performer based data. Sweden, Belgium, Switzerland, Germany, EU, and Ireland: 2021. Denmark: 2019.