University positions by age and gender
What is the division (in FTE) between men and women who hold an academic position at a university? In this data publication, we look at the distribution within different age groups and at the annual development of the proportion of men and women per position.
In short
- In all scientific positions the share of women is still smaller than the share of men, except for teachers.
- The relative share of women in academic positions decreases with age.
- The growing employment opportunities at universities are increasingly taken by women.
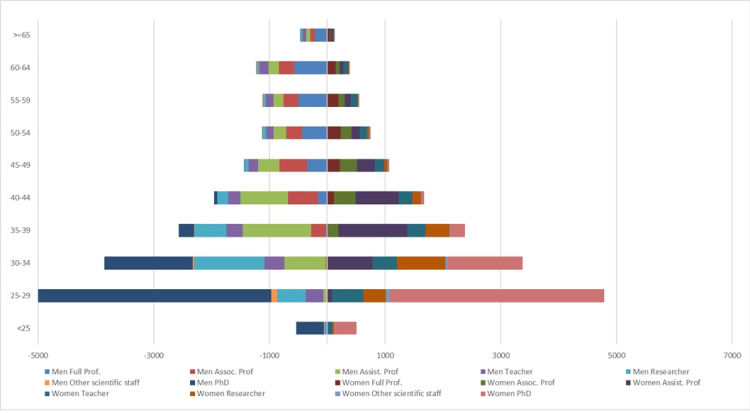
Academic careers by position, age and gender, 2024 (fte)

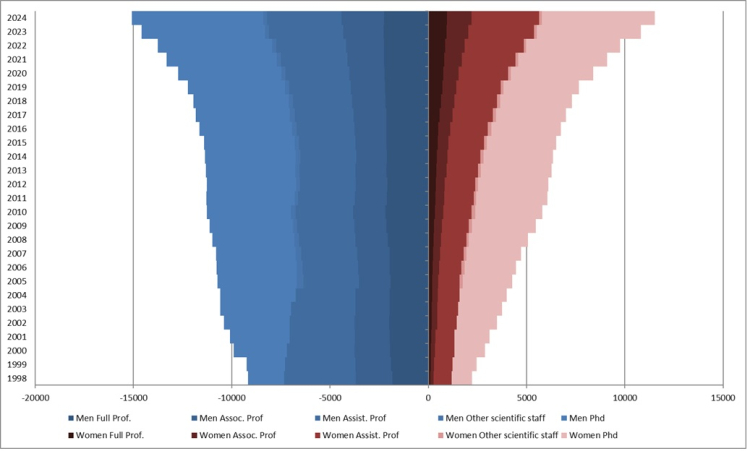
Academic careers by position, age and gender (fte)

Note: Data on the categories of teachers, researchers and other scientific staff are available from 2005 onwards.
Analysis
In 2024, the share of women in all scientific positions is still smaller than the share of men, except for the teachers. The relative share of men in academic positions increases with age. Age also correlates with position: with every career step, the gap between the share of men and women increases. The higher the position, the smaller the proportion of women. The majority of PhD students (fte) are aged 25 to 29 years; 46% of them is female. Most professors (fte) are aged between 55 and 64 years; 30% of them is female. These numbers are excluding the field of health sciences.
The number of fte in academics that is executed by women increased more in the past years than the number of fte that is executed by men. Looking at the development of male academics, we see an increase of 43% between 2005 and 2024 (from 13.694 fte in 2005 to 19.592 fte in 2024). The development of female academics shows an increase of 164% over the same period (from 5.916 fte in 2005 to 15.607 fte in 2024). The growing employment opportunities at universities are increasingly taken by women. The share of women having an academic position at a university increased from 30% in 2005 to 44% in 2024. In future numbers, we therefore expect to see a larger share of female academics in higher positions as well.